Acoustic Fingerprint
Calibration profiles and spectrogram analysis reveal the unique acoustic signature of each instrument.
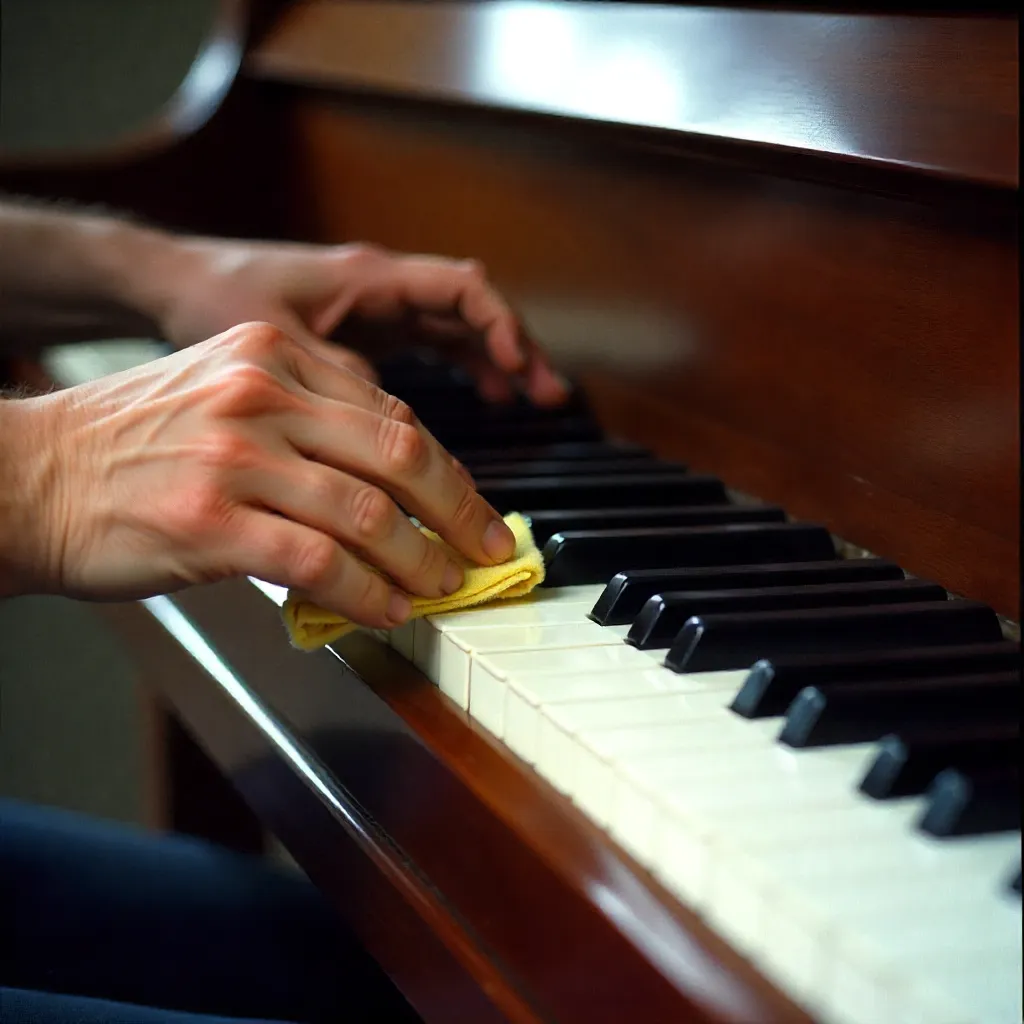
Calibration Profiles
Spectrogram Analysis
Each instrument produces a unique acoustic signature that can be visualized through spectrogram analysis. This visual representation shows frequency content, harmonic relationships, and resonance patterns.
Frequency Range: 20Hz - 20kHz | Resolution: 0.1Hz | Analysis Mode: Phase-Aligned
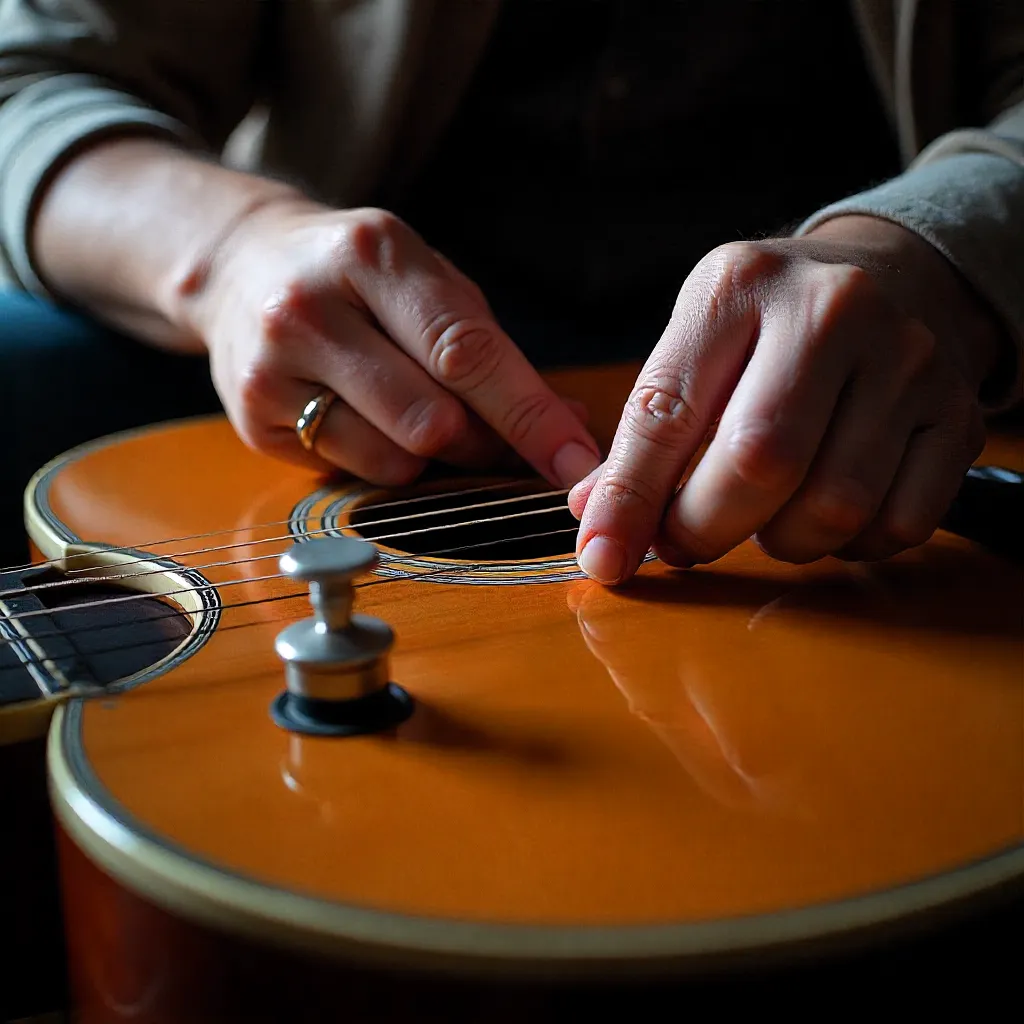
Phase Alignment

Before Calibration
Instruments that are out of phase exhibit frequency drift, harmonic distortion, and inconsistent response across different registers. The spectrogram shows irregular patterns and frequency misalignment.
Status: Out of Phase | Frequency Deviation: ±15Hz | Harmonic Distortion: 8.5%
After Phase Alignment
Following calibration, the instrument achieves phase alignment where frequencies are precisely tuned, harmonics are balanced, and the spectrogram displays clean, consistent patterns.
Status: Phase-Aligned | Frequency Deviation: ±0.1Hz | Harmonic Distortion: 1.2%
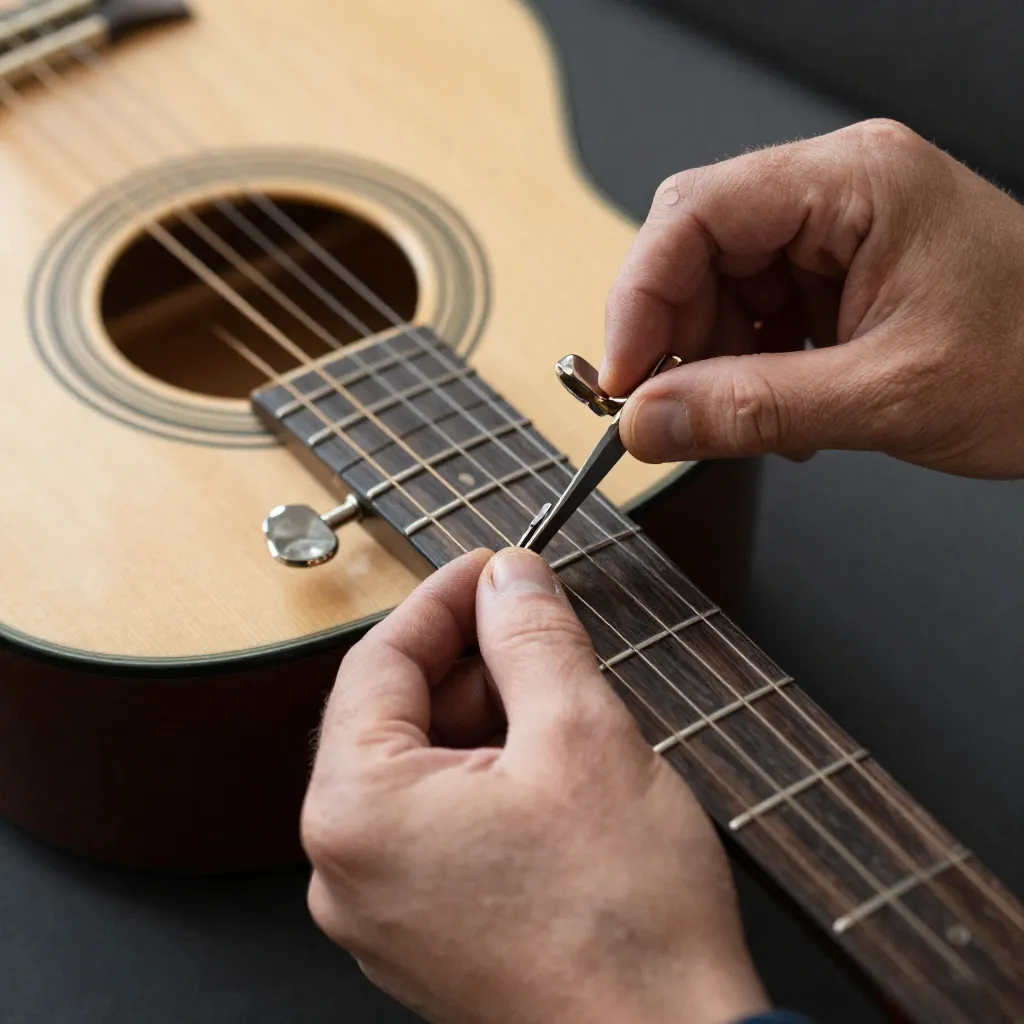
Frequency Mapping
Our calibration process involves comprehensive frequency mapping across the entire instrument range. This creates a detailed profile that documents the acoustic characteristics of each note and register.
The mapping process identifies areas where frequency response deviates from expected values. These deviations can result from mechanical wear, environmental changes, or material aging.
By comparing current measurements against baseline profiles, we can track changes over time and identify trends that may require attention before they affect performance.
Calibration Documentation

Measurement Data
Every calibration session generates detailed measurement data including frequency readings, harmonic analysis, and mechanical function assessments. This quantitative information provides objective documentation of instrument condition.
Historical Tracking
Maintaining records of calibration sessions allows us to track changes over time. This historical data helps identify patterns and predict when maintenance may be needed.